
Generation of Sample Site Locations [sp package for R]
Posted: Friday, August 15th, 2008
Premise
Setting up sampling designs is a non-trivial aspect to any field experiment that includes a spatial component. The sp package for R provides a simple framework for generating point sampling schemes based on region-defining features (lines or polygons) and a sampling type (regular spacing, non-aligned, random, random-stratified, hexagonal grid, etc.). The rgdal package provides a set of functions for importing/exporting common vector data formats. This example demonstrates simple import/export, iterating over sp objects, and reconstituting new objects from lists of objects. A more complex sampling scheme is demonstrated here.
1. Setup the environment, load some sample polygons, and tryout the spsample() function.
# load required packages
library(sp)
library(rgdal)

# read data:
# note the funky syntax
# note that this should have a REAL projection defined
# an incorrect definition may result in an error from readOGR
x <- readOGR('polys/polys.shp', layer='polys')

# spsample will not sample each polygon, rather it works on the union of polys
# try it:
plot(x) ; points(spsample(x, n=100, type='random'), col='red', pch=3, cex=0.5)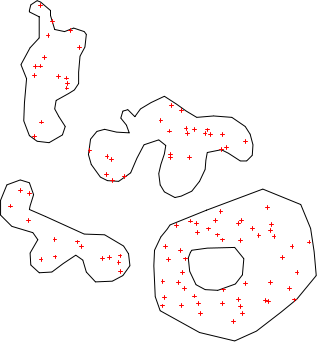
Sampling with sample example 1
2. Iterate through all polygons in our original dataset, generating approximately 100 sample points within each polygon. Note that we use sapply() it iterate through the list of polygons, and do.call('rbind', ...) to 'stack' the list elements back into a single SpatialPoints object.
# hexagonal grid from lower-left corner
s <- sapply(slot(x, 'polygons'), function(i) spsample(i, n=100, type='hexagonal', offset=c(0,0)))

# we now have a list of SpatialPoints objects, one entry per polygon of original data
plot(x) ; points(s[[4]], col='red', pch=3, cex=.5)

# stack into a single SpatialPoints object
s.merged <- do.call('rbind', s)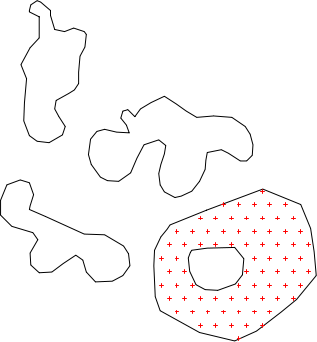
Sampling with sample example 2
3. Now that the sample points for each polygon have been merged into a single SpatialPoints object, we need to attach a dataframe with the ID associating each sample point with its parent polygon. Attaching this data will "promote" the SpatialPoints object to a SpatialPointsDataFrame object.
# add an id, based on source polygon:
#
# extract the original IDs
ids <- sapply(slot(x, 'polygons'), function(i) slot(i, 'ID'))

# determine the number of ACTUAL sample points generated for each poly
npts <- sapply(s, function(i) nrow(i@coords))

# generate a reconstituted vector of point IDs
pt_id <- rep(ids, npts)

# promote to SpatialPointsDataFrame
s.final <- SpatialPointsDataFrame(s.merged, data=data.frame(poly_id=pt_id))

# check:
plot(x) ; points(s.final, col=s.final$poly_id, pch=3, cex=0.5)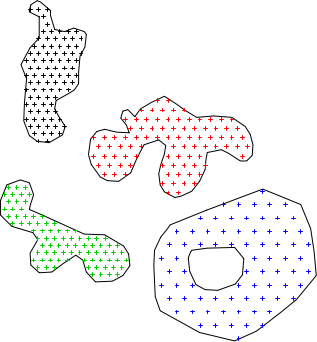
Sampling with spsample example 3
4. Copy over the spatial reference system data from the polygons object, and save sample points to a new shapefile. Note that you can only write to a shapefile if the object in question is a SpatialPointsDataFrame object.
# copy source data spatial reference system to new object
s.final@proj4string <- x@proj4string

# write out to new file
writeOGR(s.final, dsn='polys/', layer='rnd_pts', driver='ESRI Shapefile')
Links:
Customizing Maps in R: spplot() and latticeExtra functions
Working with Spatial Data
Ordinary Kriging Example: GRASS-R Bindings
