
Canopy Quantification via Image Classification
Premise:
Supervised classification of 2005 NAIP imagery (1 meter resolution) into 3 classes (grass, tree, shade), by the SMAP[1-3] algorithm. Tree heights are small compared to horizontal extent, and therefore "shadow" pixels can probably be interpreted as "tree" pixels. Field verification will be needed to check actual percent coverage of classes, and fractionation of tree species within the "tree" pixel class. Still looking up the specific date/time the source imagery was taken. Since the shadows appear to be falling north-ward, the photo was probably taken in the morning. The color of the grass suggests that it was probably summer. In these conditions there should be no shading of this region by local terrain features.
2005 NAIP Image:
http://archive.casil.ucdavis.edu/casil/remote_sensing/naip_2005/doqqs/39121/n39121c3se.tif
References:
- C. Bouman and M. Shapiro, "Multispectral Image Segmentation using a Multiscale Image Model", Proc. of IEEE Int'l Conf. on Acoust., Speech and Sig. Proc., pp. III-565 - III-568, San Francisco, California, March 23-26, 1992.
- C. Bouman and M. Shapiro 1994, "A Multiscale Random Field Model for Bayesian Image Segmentation", IEEE Trans. on Image Processing., 3(2), 162-177"
- McCauley, J.D. and B.A. Engel 1995, "Comparison of Scene Segmentations: SMAP, ECHO and Maximum Likelyhood", IEEE Trans. on Geoscience and Remote Sensing, 33(6): 1313-1316.
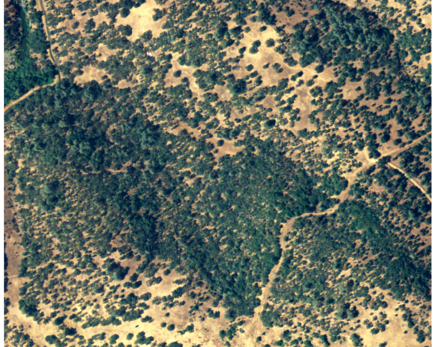
NAIP Imagery
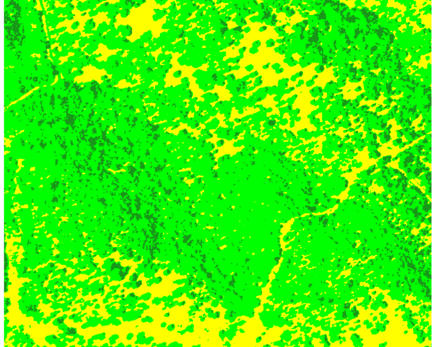
Classified Image: Yellow regions are grass, light green are tree canopy, dark green are shadows.
Combined Image: NAIP red channel (image intensity), with classes superimposed (as image hue).
Area Report
+-----------------------------------------------------------------------------+
|                   Category Information                    |          |   %  |
|#|description                                              |  hectares| cover|
|-----------------------------------------------------------------------------|
|1|grass. . . . . . . . . . . . . . . . . . . . . . . . . . | 14.039700| 23.42|
|2|tree . . . . . . . . . . . . . . . . . . . . . . . . . . | 40.025400| 66.77|
|3|shade. . . . . . . . . . . . . . . . . . . . . . . . . . |  5.876900|  9.80|
|-----------------------------------------------------------------------------|
|TOTAL                                                      | 59.942000|100.00|
+-----------------------------------------------------------------------------+
Example Procedure
g.region vect=watershed_area res=1 -a
g.region save=naip_class

# these images are cut from the SE quarter-quad
# setup imagery group
i.group group=naip sub=naip in=naip2005.red,naip2005.green,naip2005.blue

# zoom in and out digitize some training areas
r.digit out=t1 bg='d.rgb red=naip2005.red g=naip2005.green b=naip2005.blue'
r.digit out=t2 bg='d.rgb red=naip2005.red g=naip2005.green b=naip2005.blue'
r.digit out=t3 bg='d.rgb red=naip2005.red g=naip2005.green b=naip2005.blue'

# 1 grass
# 2 tree
# 3 shadow

# combine training maps
r.patch in=t1,t2,t3 out=training

# optimize colors:
i.landsat.rgb red=naip2005.red g=naip2005.green b=naip2005.blue -p

# take a look
d.rgb red=naip2005.red g=naip2005.green b=naip2005.blue
d.rast -o training

# setup classifier
i.gensigset train=training group=naip sub=naip sig=grass_tree.sig

# run classification: SMAP
i.smap group=naip sub=naip sig=grass_tree.sig out=grass_tree.class

r.colors map=grass_tree.class color=rules << EOF
1 yellow
2 green
3 25:150:25
EOF


#create checker pattern with some raster algebra-fu
r.mapcalc " v=if( (sin(5*row()) + sin(5*col())) > 0.0, null(), naip2005.red )"
r.mapcalc " i=if( (sin(5*row()) + sin(5*col())) > 0.0, grass_tree.class, null() )"

# fix color tables
r.colors map=i rast=grass_tree.class
r.colors map=v rast=naip2005.red


# looks good!
d.rast v
d.rast -o i

# one more look:
d.his i=naip2005.red h=grass_tree.class

# report
r.report -h grass_tree.class units=h,p

# quick eval of training--classified correlation
r.kappa class=grass_tree.class reference=training
MAPS: MAP1 = (untitled) (training in PERMANENT)
MAP2 = (untitled) (grass_tree.class in PERMANENT)
Error Matrix
Panel #1 of 1
MAP1
cat# 1 2 3 Row Sum
M 1 4985 0 0 4985
A 2 0 2275 143 2418
P 3 0 2 146 148
Col Sum 4985 2277 289 7551
Cats % Commission % Ommission Estimated Kappa
1 0.000000 0.000000 1.000000
2 5.913978 0.087835 0.915327
3 1.351351 49.480969 0.985949
Kappa Kappa Variance
0.958868 0.000011
Obs Correct Total Obs % Observed Correct
7406 7551 98.079725
MAP1 Category Description
1: grass
2: tree
3: shade
MAP2 Category Description
1: grass
2: tree
3: shade