
Converting Alpha-Shapes into SP Objects
Posted: Monday, April 19th, 2010
Just read about a new R package called alphahull (paper) that sounds like it might be a good candidate for addressing this request regarding concave hulls. Below are some notes on computing alpha-shapes and alpha-hulls from spatial data and converting the results returned by ashape() and ahull() into SP-class objects. Note that the functions are attached at the bottom of the page. Be sure to read the license for the alphahull package if you plan to use it in your work.
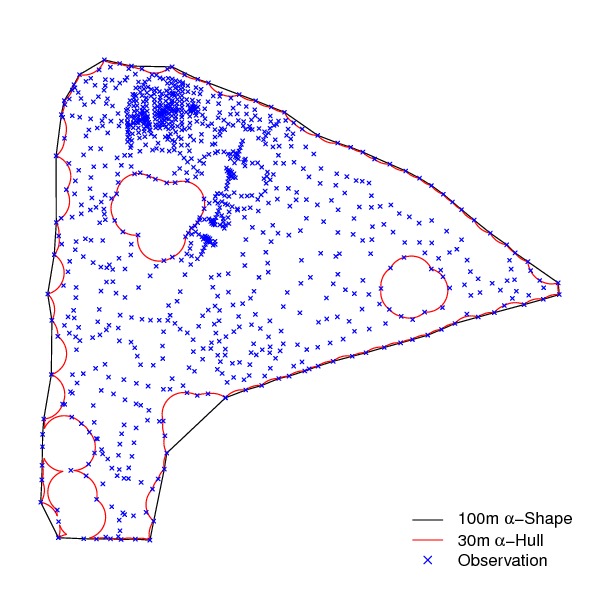
Figure Alpha-Shape Example
## not widely tested!

# need these
library(sp)
library(spgrass6)
library(alphahull)

source('alpha-functions.R')

# read point vector in from GRASS
x <- readVECT6('rtk_pts_5_1')

# extract coordinates
x.coords <- coordinates(x)

# alpha-shape: 100 meter threshold
x.as <- ashape(x.coords[,1], x.coords[,2], alpha=100)

# alpha-hull: 30 meter threshold
x.ah <- ahull(x.coords[,1], x.coords[,2], alpha=30)


plot(x.as, cex=0.5, pch=4, xlab='Easting (m)', ylab='Northing (m)', main=expression(paste('100m ', alpha, '-Shape')), asp=1)

plot(x.ah, cex=0.5, pch=4, xlab='Easting (m)', ylab='Northing (m)', main=expression(paste('30m ', alpha, '-Hull')), asp=1)


## convert into SP objects

# alpha-shape
x.as.spldf <- ashape_to_SPLDF(x.as, proj4string=x@proj4string)

# alpha-hull
x.ah.spldf <- ahull_to_SPLDF(x.ah, proj4string=x@proj4string)

# check: OK
pdf(file='ashape_ahull_demo.pdf', width=6, height=6)
par(mar=c(1,1,1,1))
plot(x.as.spldf)
lines(x.ah.spldf, col='red')
points(x, cex=0.5, pch=4, col='blue')
legend('bottomright', legend=c(expression(paste('100m ', alpha, '-Shape')), expression(paste('30m ', alpha, '-Hull')), 'Observation'), lty=c(1,1,NA), pch=c(NA,NA,4), col=c('black', 'red', 'blue'), bty='n')
dev.off()


# save back to GRASS: OK
writeVECT6(x.as.spldf, 'rtk_ashape')

# save back to GRASS: OK
writeVECT6(x.ah.spldf, 'rtk_ahull')
Attachment: alpha-functions.R
Links:
Working with Spatial Data
Customizing Maps in R: spplot() and latticeExtra functions
